pmdarima.utils.decomposed_plot
-
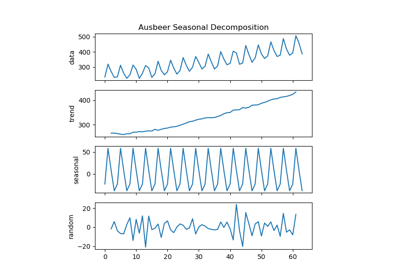
pmdarima.utils.decomposed_plot(decomposed_tuple, figure_kwargs=None, show=True)[source][source]¶ Plot the decomposition of a time series.
Plots the results of the time series decomposition in four plots: the ‘x’, ‘trend’, ‘seasonal’, and ‘random’ components.
Parameters: decomposed_tuple : tuple, namedtuple or iterable
Named tuple of series that consist of data, trend, seasonal, and random. Should be the result of
pmdarima.arima.decompose().figure_kwargs : dict, optional (default=None)
Optional dictionary of keyword arguments that are passed to figure.
show : bool, optional (default=True)
Whether to show the plot after it’s been created. If not, will return the plot as an Axis object instead.
Notes
This method will only show the plot if
show=True(which is the default behavior). To simply get the axis back (say, to add to another canvas), useshow=False.